SET UP AN ANDROID REVERSE ENGINEERING ENVIRONMENT
Introduction
The process of reverse engineering an Android application (whether for malware analysis, testing purposes or development) requires a specific working environment. In this article we will set up an android RE environment that will help us analyse Android applications and understand what they do and how they do it (and perhaps find some vulnerabilities).
There are certain tools we will find ourselves using commonly, as listed below (these are not all the tools we will use for reverse engineering Android Applications, but the most basic ones to start with — I will post some other articles in the future about the rest):
ADB: Android Debug Bridge
This is the most basic way of communication with a device (whether it’s a physical device or an emulator). It consists of three components:
1) The server (background process): handles comms between client and daemon
2) The daemon (background process): runs the commands from the client on a specific device
3) The client: sends commands to a specific device
You will need to enable USB Debugging in your physical device to use adb (emulators should have this option enabled by default).
More details about enabling USB debugging, Wifi-Debugging, etc. can be found here: https://developer.android.com/studio/command-line/adb. You can get the stand-alone SDK Platform Tools package (which includes adb) here: https://developer.android.com/studio/releases/platform-tools.
The most basic commands are:
$ adb devices
List of devices attached
1e28642c    device
This will launch the adb server and daemon if not running in the background already.
If you don’t have USB Debugging enabled on your device, nothing will be listed above. And if you haven’t accepted the connection prompted in your device screen, with the RSA public key of your workstation — for Android 4.2.2 or higher), you will be unauthorised:
$ adb devices
List of devices attached
1e28642c    unauthorized
If you only have a single device connected, you can interact with it by typing the command without needing to specify the id. So this:
$ adb -s 1e28642c shell
Equals this:
$ adb shell
The command above is used to run a terminal on the target device. We can also issue individual commands like this:
$ adb shell id
uid=2000(shell) gid=2000(shell) groups=2000(shell),1004(input),1007(log),1011(adb),1015(sdcard_rw),1028(sdcard_r),1078(ext_data_rw),1079(ext_obb_rw),3001(net_bt_admin),3002(net_bt),3003(inet),3006(net_bw_stats),3009(readproc),3011(uhid) context=u:r:shell:s0
Most of the shell commands are provided by toybox (https://github.com/landley/toybox). A more comprehensive list of commands like am (activity manager), pm (package manager) or dpm (device policy manager) can be found here: https://developer.android.com/studio/command-line/adb#shellcommands
If your device is rooted, you might need to restart adb as root to interact with it as a privileged user:
$ adb root
Attention! Once you grant root access to a device using the command above, you will need to restart it if you want to lose the privileges and revert to a less privileged shell.
Install an APK on the target device by typing:
$ adb install path_to_apk
Upload a file (or directory with all sub-directories) to the target device:
$ adb push local_file_or_directory device_directory
Ex. place document.txt in the device /sdcard/ folder:
$ adb push /home/user/document.txt /sdcard/
Download a file (or directory with all sub-directories) to your workstation:
$ adb pull device_file_or_directory local_directory
Ex. place document.txt from the device /sdcard/ folder:
$ adb pull /sdcard/document.txt /home/user/
If you run into issues with adb you can always restart the server with:
$ adb kill-server
Finally, the commands for restarting and shutting down an emulator/device are:
1. Reboot emulator/device:
$ adb reboot
2. Shutdown emulator/device:
$ adb reboot -p
ANDROID STUDIO
Eventually you will need to create your very own Android application, as a reverse engineering exercise. For this, you will need a development environment. Although there are many options we will use Android Studio, the official IDE for Android Development: https://developer.android.com/studio. It also includes the Android SDK and Android AVD (for emulators).
In this article we will only cover the creation and management of AVDs, as other tools like the Android Debugger or the Dalvik Debug Monitor Service (DDMS) would require their very own.
ANDROID EMULATOR & AVDMANAGER
We can use the Android AVD via Android Studio to create and run emulators, so we can run apps without using a physical device. Emulators can be launched either from Android Studio (via the toolbar, selecting AVD and the target device) or via command line.
Some of the commands you will need to interact with an emulator are as follows:
Display a list of available AVD names:
$ emulator -list-avds
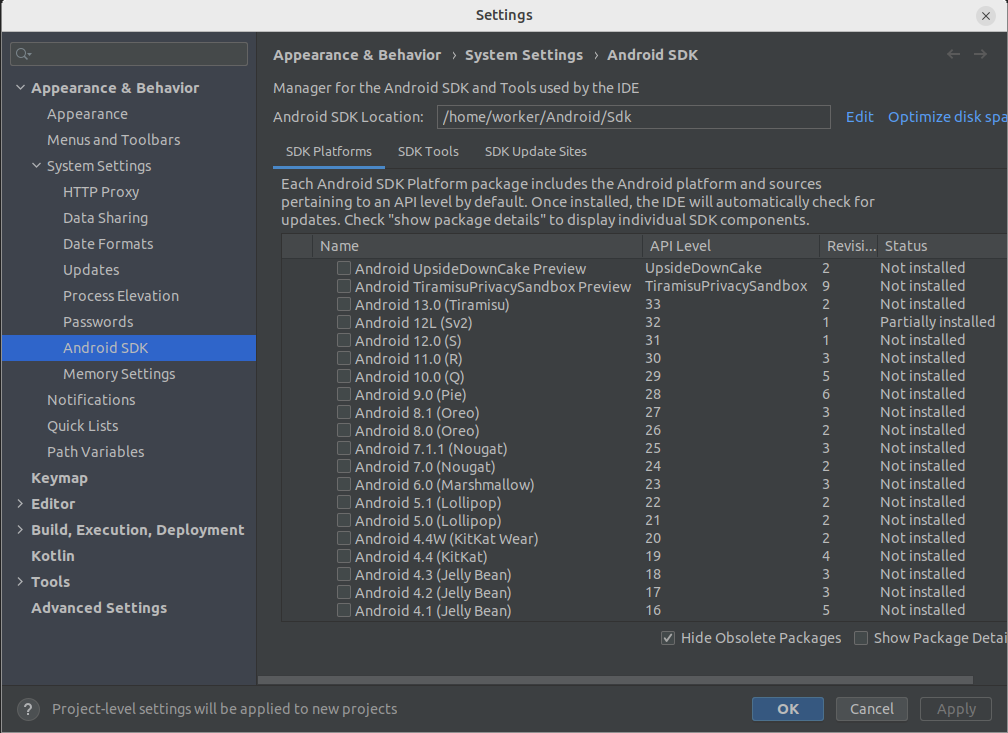
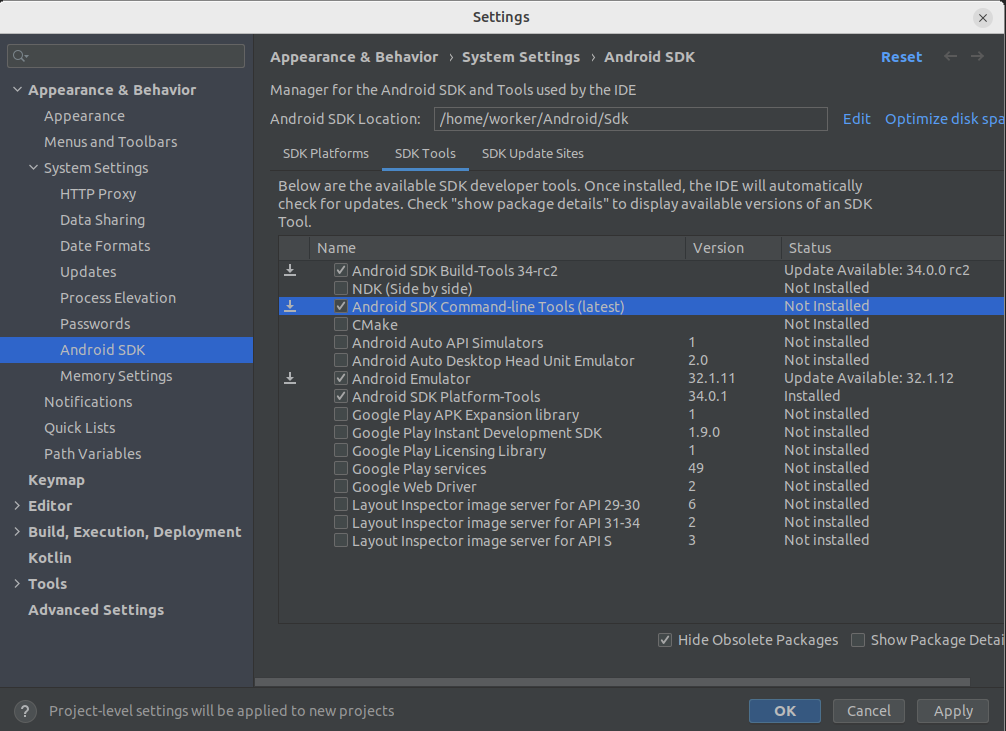
If we don’t see any AVDs listed above, we might need to create one. We can do so again via Android Studio (via Device Manager) or command line. If we choose to do it via command line, we will need to have the Android SDK installed (which can also be done via Android Studio -> Tools -> SDK Manager).
We need to install the SDK Platform and Tools.
 After it’s been successfully installed (on Linux, under
 ~/Android/Sdk/cmdline-tools/latest/bin — make sure you export this route to your PATH environment variable so you can use the commands outside of the sdk folder), we can run the following command to see what Android images are available to download:
$ sdkmanager --list | grep system-images
  system-images;android-22;google_apis;x86              | 26         | Google APIs Intel x86 Atom System Image
  system-images;android-24;google_apis;x86              | 27         | Google APIs Intel x86 Atom System Image
  system-images;android-28;google_apis_playstore;x86    | 9          | Google Play Intel x86 Atom System Image
  ...
From the resulting list above we can select a suitable Android image for our AVD and download it:
$ sdkmanager --install "system-images;android-31;google_apis;x86_64"
Once the image has been downloaded we can proceed to create our AVD:
$ avdmanager create avd --name testingAvd --package "system-images;android-31;google_apis;x86_64" --abi "x86_64"
[=======================================] 100% Fetch remote repository...
Do you wish to create a custom hardware profile? [no] no
Alternatively you can skip the prompt by sending this command instead:
$ echo "no" | avdmanager create avd --name testingAvd --package "system-images;android-31;google_apis;x86_64" --abi "x86_64"
As opposed to the above, we can delete a virtual device as follows:
$ avdmanager delete avd -n testingAvd
Full documentation can be found here: https://developer.android.com/tools/avdmanager
Now we have an AVD ready to be used.
To run a specific AVD:
$ emulator -avd AVDNAME
or alternatively:
$ emulator @AVDNAME
Ex. Run:
$ emulator -avd Pixel_3_XL_API_24
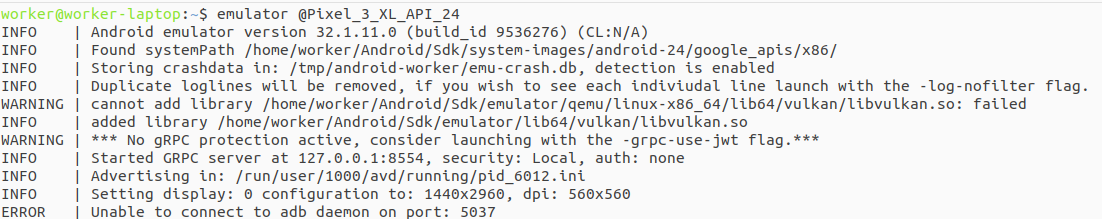
If we encounter the following error in the log:
ERROR | Unable to connect to abd daemon on port
We will need to manually launch the adb-server.
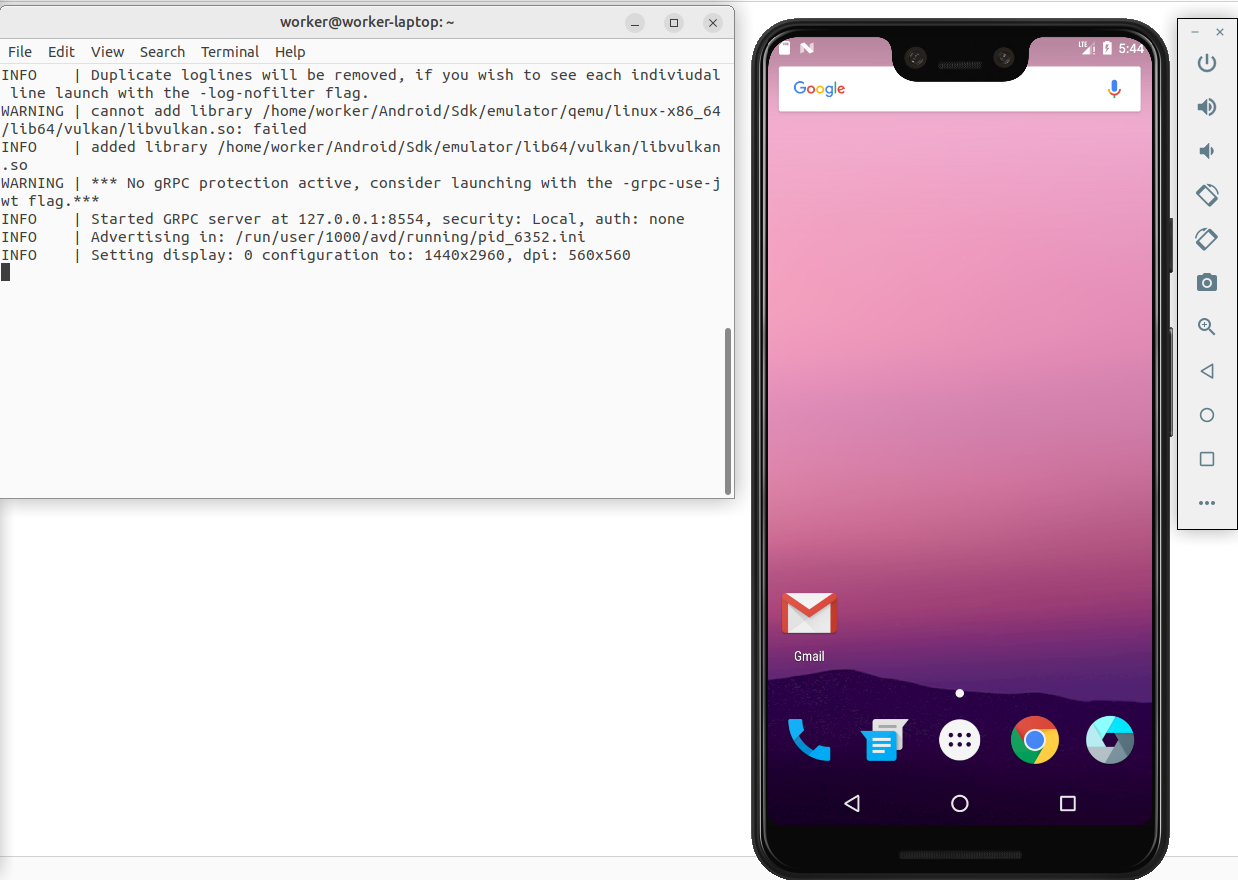
The expected output will be as follows:
Writable System Image
In some scenarios we might want to have a writeable system image during the emulation session (i.e. to add a custom certificate to cacerts and monitor https traffic with a MitM). We can do so with the following command:
$ emulator -avd Pixel_3_XL_API_24 -writable-system
We will also need to issue the following adb commands for this to take effect:
$ adb root && adb remount
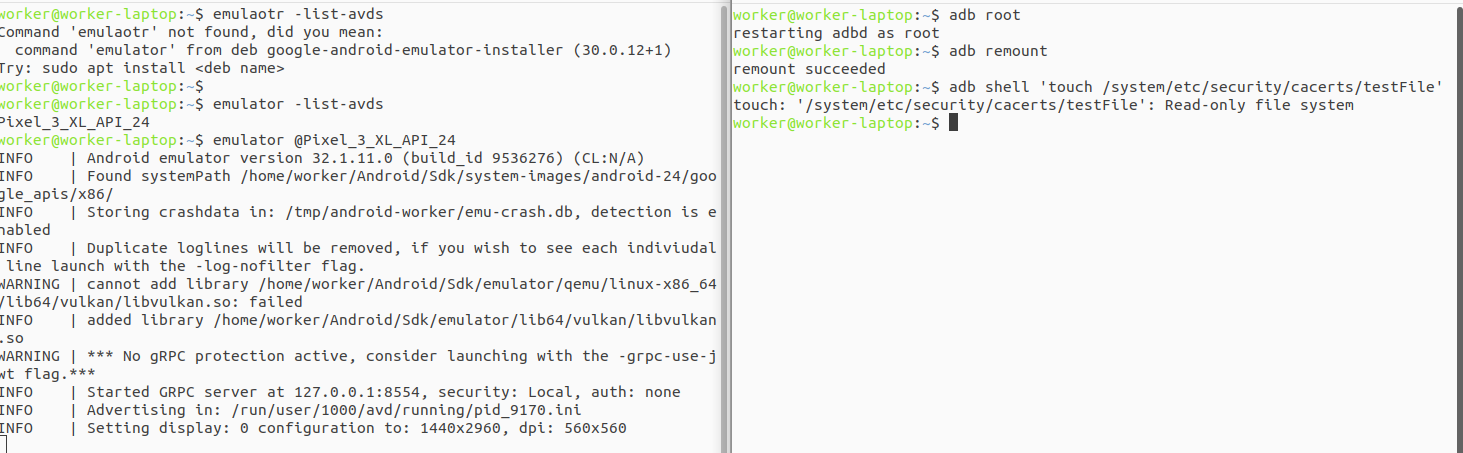

When we issue the adb root command, we force the abdd daemon not to drop privileges (otherwise we would interact with the device as a shell user). Some AVDs or physical devices won’t allow us to change that property (a typical error would be adbd cannot run as root in production builds which means that non-user builds are not allowed to changed the property).
If we’re using the emulator and we face this error, we should use a userdebug build instead of a production build (normally flagged as using “Google Play” in the AVD Manager).
Traffic Analysis
One last interesting thing to mention is that the Android emulator supports both proxying of traffic as well as dumping traffic to a PCAP format packet trace. This might be interesting if we need to perform some analysis on the traffic sent back and forth by the apps installed.
The parameter for enabling proxies is:
$ emulator @Pixel_3_XL_API_24 -http-proxy http://127.0.0.1:8080
Being http://127.0.0.1:8080 our proxy (the http:// string can be omitted).
A note on this command: some apps won’t allow traffic at all through a proxy (especially if the certificate is not trusted), others will but will let you know that there’s an error with the SSL Certificate but still allow you to read all comms without a problem. I will write another article in the near future for successfully analysing http traffic being sent by apps.
The other parameter mentioned, for dumping traffic is:
$ emulator @Nexus_5X_API_23 -tcpdump /path/dumpfile.cap
Where /path/dumpfile.cap is the output file containing the traffic dump.
Once again, it’s worth mentioning that any https traffic in the dump will be encrypted, and sniffing and analysing this will be covered in a different article.
Full list of commands for the emulator can be found here: https://developer.android.com/studio/run/emulator-commandline
Telnet Console
When running an emulator, you can also alter the status of the emulated device via telnet. In order to do so, we need to know on which port it is listening:
$ adb devices
List of devices attached
emulator-5554   device
In this case local port is 5554. We need to run telnet as follows:
$ telnet localhost 5554
Trying 127.0.0.1...
Connected to localhost.
Escape character is '^]'.
Android Console: Authentication required
Android Console: type 'auth <auth_token>' to authenticate
Android Console: you can find your <auth_token> in
'/home/user/.emulator_console_auth_token'
OK
If we notice, in order to send any command to change statuses, we need to authenticate first. The authentication token can be found in the path shown in the output above.
Full list of console commands can be found here: https://developer.android.com/studio/run/emulator-console